4. Performing all calculations at once
To install pyAp, one can first download pyAp or clone from the github. Then change the working directory to your download folder, assume one downloaded from github as pyAp-main, for example:
$ cd pyAp-main
If you downloaded the lastest version of pyAp, there should be several directories including a setup.py script, docs, pyAp, example, contrib and tutorial folders.
Then one can run the python command to install setup.py file in the folder as:
$ python setup.py install
pyAp includes a python script integrated all models and runs with command line. To use the script, one should change the working directory to the example folder:
$ cd example
Note that for windows users, the command line commands work in Anaconda prompt or shell like terminal. For Mac users, the commands can run directly in the terminal. Excute the script with a python command:
$ python run_all-in-one.py

Let us start!

Calculate mole fractions and a.p.f.u. ?(y/n):y
By choosing y as yes and n as no to continue or skip the calculation.
>> results saved to csv!

         SI        TI        AL  ...        SR  stoi,(Ca/P-5/3)/(5/3)*100%  sample
0  0.017412  0.013097  0.020520  ...  0.010095                    3.656599     Ap1
1  0.017514  0.013175  0.020641  ...  0.010155                    3.656599     Ap2
2  0.017419  0.013103  0.020528  ...  0.010100                    3.656599     Ap3

[3 rows x 19 columns]
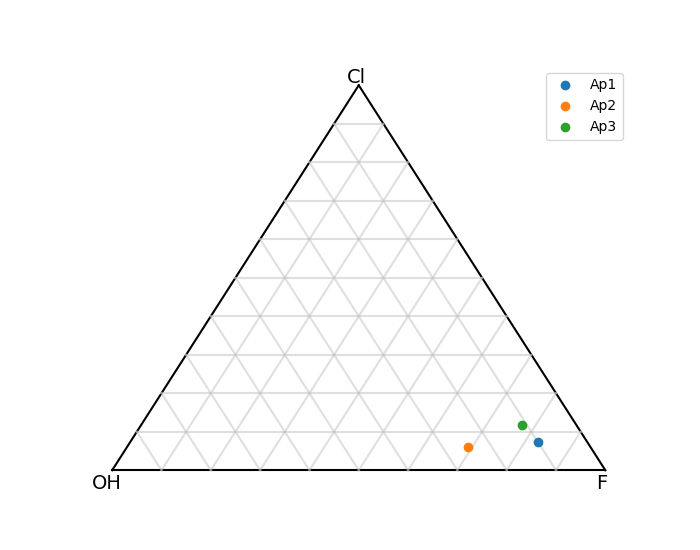
Then we continue to plot the F-Cl-OH ternary diagram of apatite:
Plot F-Cl-OH ternary ?(y/n):y

Close the plot window for next step. Before closing it you could save the plot by clicking on the "save" button in the same window.
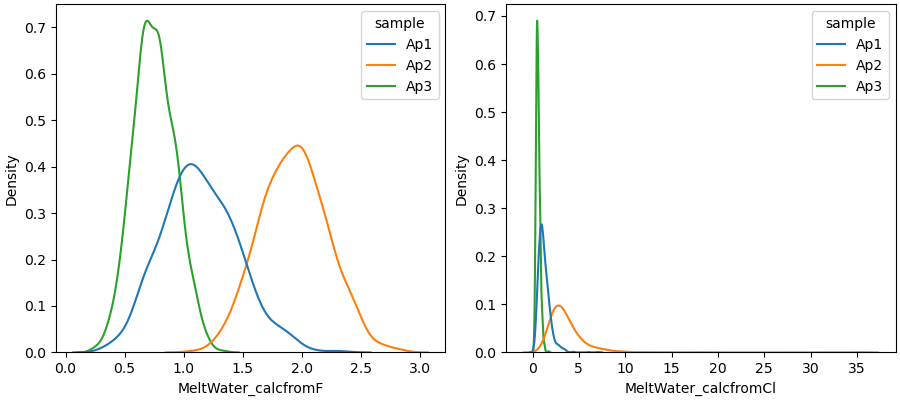
Calculate melt H 2 O concentration:
Calculate melt H2O concentraion?(y/n): y


Use mole fractions just calculated?(y/n): y
The MCS is also integrated in the script, the default is to run 1000 times:
Run MC for error propagation?(y/n): y
>> Simulation starts ...

>> Simulation completed

>> mc = 1000. All MC results are saved in csv file: outputs_melt_water_allin1.csv

   MeltWater_calcfromF  ...  MeltWater_Cl_error,100%
0             1.101500  ...                48.146486
1             1.937091  ...                43.507000
2             0.744809  ...                35.141224

[3 rows x 9 columns]

>> The median and standard deviation of MC results are saved in csv file: outputs_melt_water_allin1.csv
Close the plot window for next step. Before closing it you could save the plot by clicking on the "save" button in the same window.